使用 Blackbox Exporter 监控网站性能:Grafana 的好搭档
如果您喜欢使用 Grafana 监控服务器指标,那么您一定会爱上用于网站监控的 Blackbox Exporter!
本教程将指导您在 CentOS/RHEL 系统上安装 Blackbox Exporter,并演示如何将其与 Prometheus 和 Grafana 结合使用,以实现对网站性能和正常运行时间的全面监控。
什么是 Blackbox Exporter?
Blackbox Exporter
是 Prometheus 的一个工具,专门用于探测各种端点,包括 HTTPS、HTTP、TCP、DNS 和 ICMP。 一旦定义了需要监控的端点,Blackbox Exporter 就会生成大量的指标数据,这些数据可以通过 Grafana 进行可视化呈现。 其中,测量响应时间是 Blackbox Exporter 最为重要的功能之一。
Blackbox Exporter 是一种自托管解决方案。 如果您正在寻找类似的,但以 SaaS 或基于云的服务形式提供的解决方案,可以考虑使用 Grafana worldPing。
前提条件
在开始之前,请确保您已经安装了 Prometheus 和 Grafana。 如果尚未安装,请按照相关指南完成安装。
Blackbox Exporter 安装步骤
接下来,我们将详细介绍 Blackbox Exporter 的安装过程。
步骤 1:下载 Blackbox Exporter
访问
官方网站,下载适用于 Linux AMD 架构的最新 Blackbox Exporter 安装包。 在本例中,我们将下载
blackbox_exporter-0.16.0.linux-amd64.tar.gz 文件。
- 将下载的文件传输到您的服务器。
- 从压缩包中解压文件。
[[email protected] ~]$ tar -xzf blackbox_exporter-0.16.0.linux-amd64.tar.gz
解压后,检查 Blackbox Exporter 的文件内容。
      [[email protected] ~]$ cd blackbox_exporter-0.16.0.linux-amd64/
      [[email protected] blackbox_exporter-0.16.0.linux-amd64]$ ls -l
      total 16672
      -rwxr-xr-x. 1 centos centos 17050332 Nov 11 2019 blackbox_exporter
      -rw-r--r--. 1 centos centos 629 Nov 11 2019 blackbox.yml
      -rw-r--r--. 1 centos centos 11357 Nov 11 2019 LICENSE
      -rw-r--r--. 1 centos centos 94 Nov 11 2019 NOTICE
这里需要关注两个文件: blackbox_exporter 和 blackbox.yml。
-
blackbox_exporter:这是一个可执行文件,用于运行 Blackbox Exporter 服务。 -
blackbox.yml:这是一个 YAML 配置文件,其中定义了所有需要探测的端点以及 Blackbox Exporter 的配置信息。
通过以下命令,可以查看 Blackbox Exporter 支持的所有命令行参数:
      [[email protected] blackbox_exporter-0.16.0.linux-amd64]$ ./blackbox_exporter -h
      usage: blackbox_exporter [<flags>]

      Flags:
      -h, --help Show context-sensitive help (also try --help-long and --help-man).

      --config.file="blackbox.yml"
      Blackbox exporter configuration file.
      --web.listen-address=":9115"
      The address to listen on for HTTP requests.

      --timeout-offset=0.5 Offset to subtract from timeout in seconds.

      --config.check If true validate the config file and then exit.

      --history.limit=100 The maximum amount of items to keep in the history.

      --web.external-url=<url>
      The URL under which Blackbox exporter is externally reachable (for example, if Blackbox exporter is served via a
      reverse proxy). Used for generating relative and absolute links back to Blackbox exporter itself. If the URL has a
      path portion, it will be used to prefix all HTTP endpoints served by Blackbox exporter. If omitted, relevant URL
      components will be derived automatically.

      --web.route-prefix=<path>
      Prefix for the internal routes of web endpoints. Defaults to path of --web.external-url.

      --log.level=info Only log messages with the given severity or above. One of: [debug, info, warn, error]

      --log.format=logfmt Output format of log messages. One of: [logfmt, json]
      --version Show application version.
步骤 2:创建 Blackbox 用户
这是一个可选步骤。
您可以创建一个新的用户来运行 Blackbox,或者使用现有的 Prometheus 用户。
确保该用户拥有足够的权限,并将其设置为 Blackbox Exporter 文件和目录的所有者。
      [[email protected] ~]$ sudo useradd -rs /bin/false blackbox
      [[email protected] ~]$ sudo chmod -R 777 /home/centos/blackbox_exporter-0.16.0.linux-amd64
      [[email protected] ~]$ sudo chown -R blackbox:blackbox /home/centos/blackbox_exporter-0.16.0.linux-amd64
步骤 3:配置 Blackbox 服务
现在,我们需要将 Blackbox Exporter 配置为 systemd 服务。 创建 blackbox.service 文件,并添加以下内容,然后保存。
      [[email protected] ~]$ sudo gedit /etc/systemd/system/blackbox.service

      [Unit]
      Description=Blackbox Exporter Service
      Wants=network-online.target
      After=network-online.target

      [Service]
      Type=simple
      User=blackbox
      Group=blackbox
      ExecStart=/home/centos/blackbox_exporter-0.16.0.linux-amd64/blackbox_exporter --config.file=/home/centos/blackbox_exporter-0.16.0.linux-amd64/blackbox.yml

      [Install]
      WantedBy=multi-user.target
请务必将路径修改为您实际解压 Blackbox Exporter 的位置。
步骤 4:启动 Blackbox Exporter
执行以下命令,启动 Blackbox Exporter 服务。
      [[email protected] ~]$ sudo systemctl daemon-reload
      [[email protected] ~]$ sudo systemctl start blackbox.service
      [[email protected] ~]$ sudo systemctl status blackbox.service
      ● blackbox.service - Blackbox Exporter Service
      Loaded: loaded (/etc/systemd/system/blackbox.service; enabled; vendor preset: disabled)
      Active: active (running) since Sat 2020-06-13 17:28:40 EDT; 1s ago
      Main PID: 30427 (blackbox_export)
      Tasks: 5
      CGroup: /system.slice/blackbox.service
      └─30427 /usr/local/bin/blackbox_exporter --config.file=/etc/blackbox.yml

      Jun 13 17:28:40 techblik.com.linuxvmimages.com systemd[1]: Started Blackbox Exporter Service.
      Jun 13 17:28:40 techblik.com.linuxvmimages.com blackbox_exporter[30427]: level=info ts=2020-06-13T21:28:40.283Z caller=main.go:212 msg="Starting b...b9a9)"
      Jun 13 17:28:40 techblik.com.linuxvmimages.com blackbox_exporter[30427]: level=info ts=2020-06-13T21:28:40.283Z caller=main.go:213 msg="Build cont...SSING)
      Jun 13 17:28:40 techblik.com.linuxvmimages.com blackbox_exporter[30427]: level=info ts=2020-06-13T21:28:40.283Z caller=main.go:225 msg="Loaded config file"
      Jun 13 17:28:40 techblik.com.linuxvmimages.com blackbox_exporter[30
至此,Blackbox Exporter 已经成功启动。 您可以在
http://localhost:9115/
访问运行中的 Blackbox Exporter。
将 Blackbox Exporter 与 Prometheus 集成
接下来,我们需要将 Blackbox Exporter 与 Prometheus 集成,以便开始收集监控指标。
-
在
prometheus.yml文件中添加一个针对 Blackbox 的作业配置。 这里我们以监控
https://www.telegraph.co.uk
的性能为例。
      [[email protected] ~]$ sudo gedit /etc/prometheus/prometheus.yml

      - job_name: 'blackbox'
        metrics_path: /probe
        params:
          module: [http_2xx] # Look for a HTTP 200 response.
        static_configs:
          - targets:
            - https://www.telegraph.co.uk
        relabel_configs:
          - source_labels: [__address__]
            target_label: __param_target
          - source_labels: [__param_target]
            target_label: instance
          - target_label: __address__
            replacement: 127.0.0.1:9115 # The blackbox exporter's real hostname:port.
[[email protected] ~]$ sudo systemctl restart prometheus.service
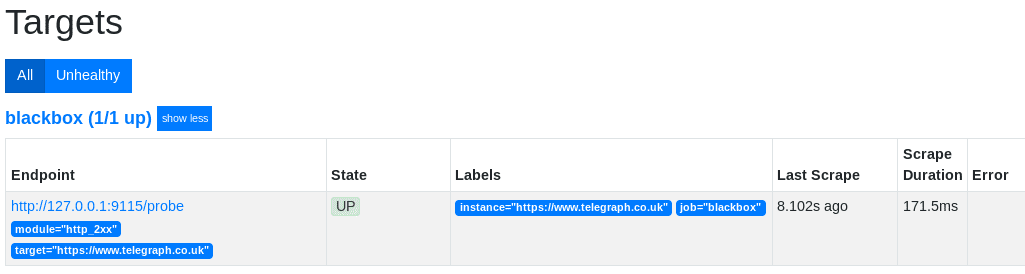
-
再次访问
http://localhost:9090/targets
,您会发现一个名为 ‘blackbox’ 的作业正在运行,并监控您配置的端点。
- 点击图表,并运行查询 –
probe_http_duration_seconds。
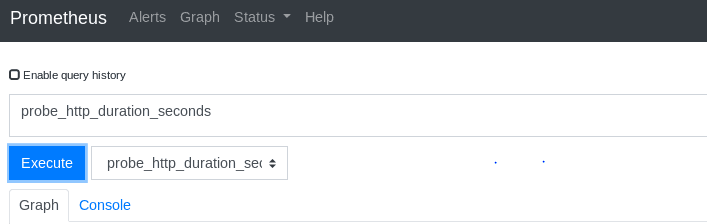
- Prometheus 将会可视化监控到的数据。
现在,我们将 Blackbox 的监控数据在 Grafana 上进行可视化。
实现这一目标的方法有很多,最快的方法之一是使用现成的仪表板 –
Prometheus Blackbox Exporter
。
- 打开 Grafana 仪表板,点击 + 号,然后点击 “Import”。
- 在 “Import via grafana.com” 中,输入仪表板 ID 7587 并点击 “Load”。
- 然后选择 Prometheus 数据源,并点击 “Import”。
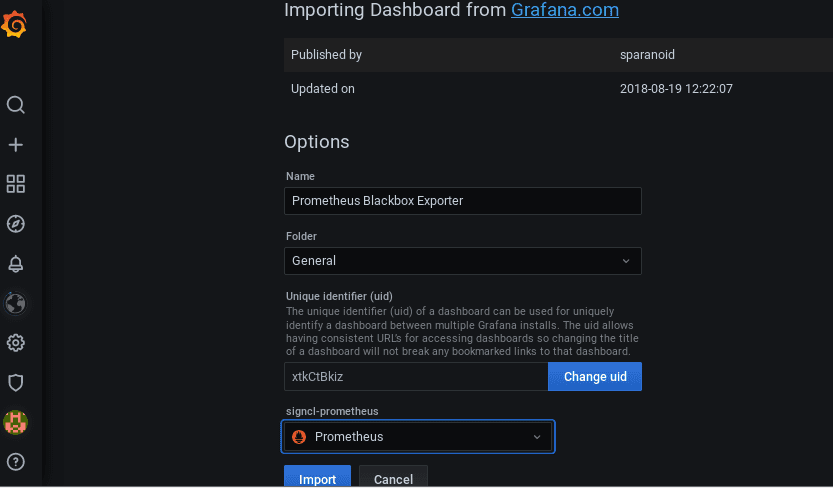
- 现在,Prometheus Blackbox Exporter 仪表板已成功导入。
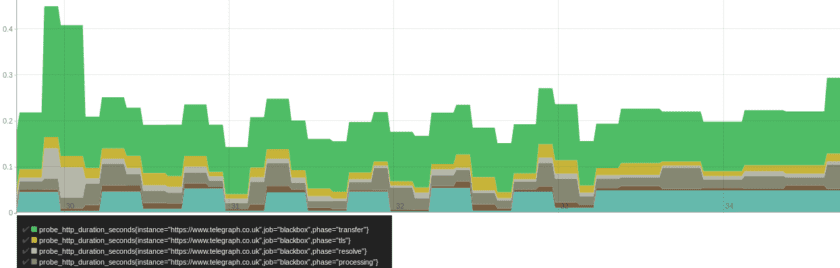
- 您现在可以可视化各种指标,包括全局探测持续时间、状态、HTTP 持续时间、平均探测持续时间、平均 DNS 查找时间、SSL 过期时间等等。
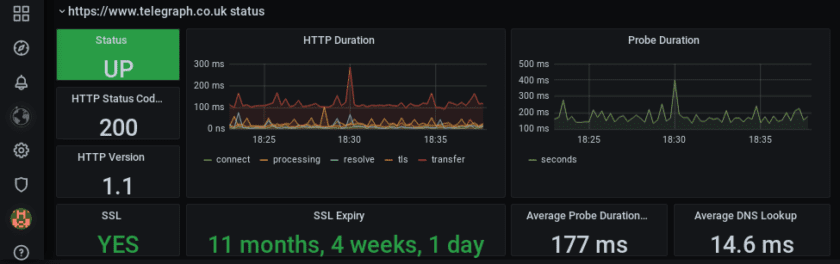
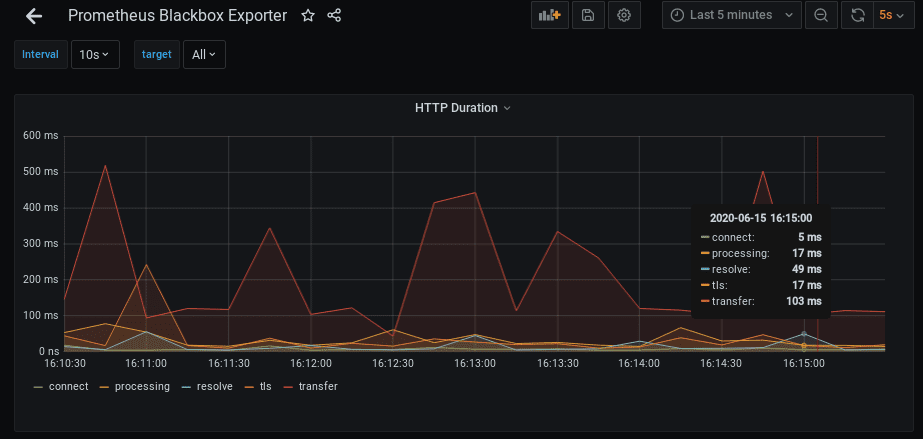
- 这些都是仪表板上的独立面板。 让我们详细看看 HTTP 持续时间面板。 此面板显示了连接、处理、解析、TLS 和传输请求所花费的时间可视化。
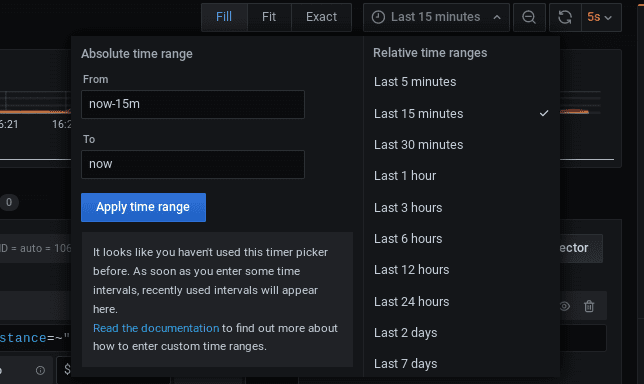
仪表板提供了许多自定义选项。您可以更改想要显示的时间范围,也可以调整数据刷新的时间间隔。默认情况下,新数据每 5 秒更新一次。
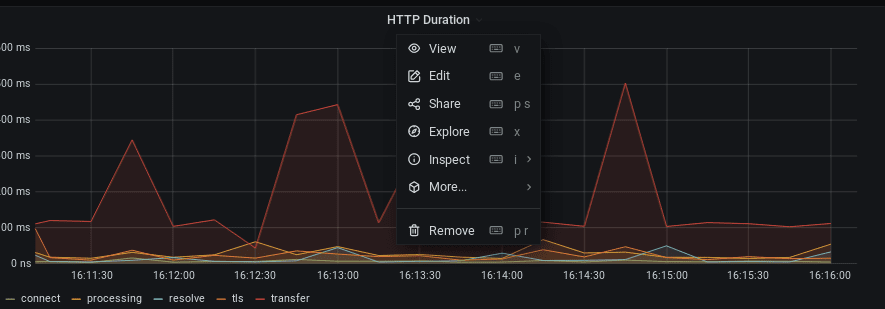
- 当您点击 HTTP 持续时间旁的向下箭头时,您会看到如下选项。 点击 “编辑”。
-
在可视化面板下方,您可以看到一个查询编辑器。 当前面板可视化的是
probe_http_duration_seconds查询。
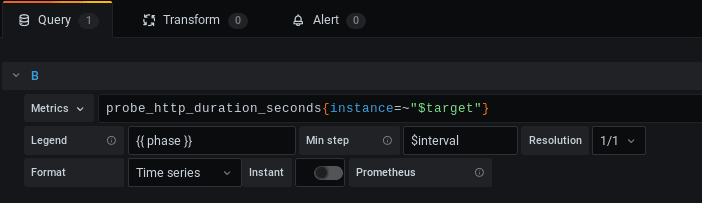
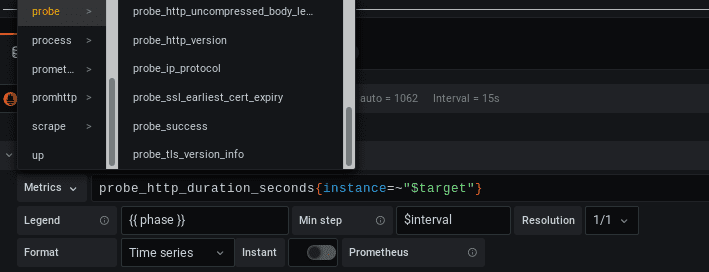
- 有数百个可用的查询,您可以轻松地进行可视化,并根据需要添加到仪表板中。
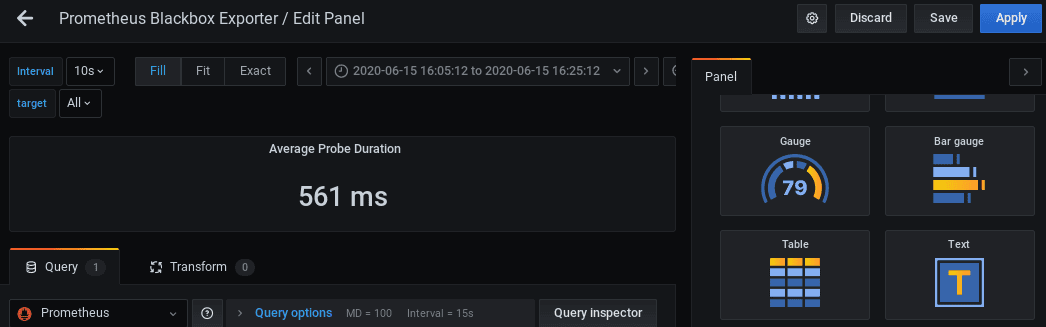
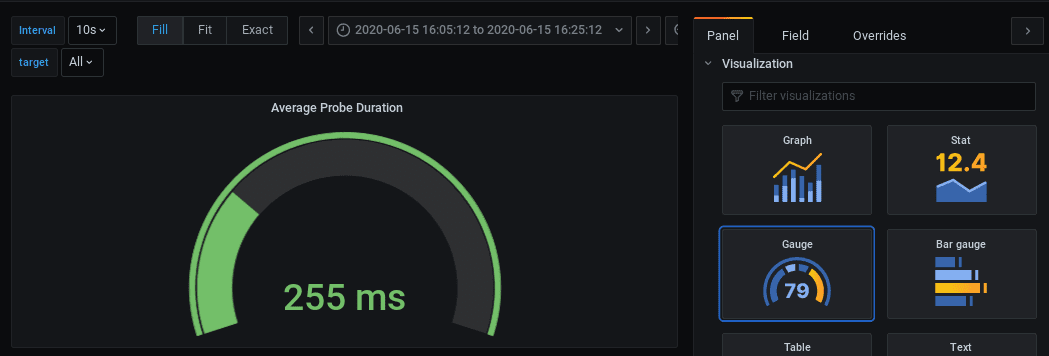
- 您还可以更改可视化的类型。 仪表板上以文本格式显示平均探测持续时间。 在右侧的可视化面板中,将平均探测持续时间的选项改为 “仪表”。
- 现在,可视化效果已经改变了。
总结
本文只是初步介绍了使用 Prometheus Blackbox 和 Grafana 监控网站性能的简单方法。 有大量的选项可供探索,强烈建议您亲自尝试体验。 如果您对学习 Grafana 感兴趣,可以参考他的
在线课程。
喜欢这篇文章吗?请分享给其他人!